The LTV to CAC ratio is a unit economics measure, comparing the contribution margin a customer generates over a set period with the full cost of acquiring them, that helps DTC and CPG operators decide how much they can spend to grow without losing cash.
The version most teams quote is built on revenue or gross margin and on whatever an ad platform counts as a new customer. That flatters acquisition. Fulfillment, shipping, payment fees and returns drop out of the math before anyone sees the final number.
Fix the inputs first. Run customer lifetime value (LTV) on contribution margin (CM) instead of gross revenue, and count customer acquisition cost (CAC) fully loaded instead of as a platform’s media-spend line.
Pair the ratio with a payback limit. Then set the ratio and payback target by category, weighing repurchase speed, return rates and margin left after fulfillment.
Platform-reported return on ad spend (ROAS) looks healthier than the cash a brand banks, and the article covers why. Ownership splits three ways: the growth seat drives acquisition, the finance seat drives the margin math, and an executive settles it when the two disagree.
Key takeaways
A healthy LTV:CAC ratio for a DTC brand depends on payback, not on hitting 3:1. The 3:1 rule comes from David Skok’s SaaS guidelines, which assume an 80%+ gross margin and a business where CAC mostly funds sales and marketing teams working a sales cycle. A DTC brand should set its own target from its category’s repeat and returns behavior, and pair it with a payback limit its cash cycle can carry.
Calculate LTV on contribution margin, not revenue or gross profit margin. Revenue per customer reflects average order value and purchase frequency, but LTV should count only the CM2 a cohort leaves behind after fulfillment, shipping, payment fees and returns, measured over a fixed window. A higher average purchase value lifts LTV only if that margin survives those costs.
Platform-reported ROAS overstates how efficient acquisition is. Each ad platform credits purchases inside its own attribution window, so one order can be counted by several platforms. Break-even ROAS on CM2 margin also sits well above break-even on gross margin. Judge acquisition on fully loaded new-customer CAC pulled from order data.
Ownership of the LTV:CAC ratio works best when it’s shared. The Head of Growth or CMO runs customer acquisition strategies inside a CAC ceiling set by finance. The CFO or Head of Finance owns the margin-adjusted LTV figure and the formula behind it. The CEO or General Manager makes the final call on growth versus cash.
What is the LTV to CAC ratio?
The LTV to CAC ratio, often written LTV:CAC, is LTV divided by CAC. It compares what a customer is worth with what it cost to acquire them.
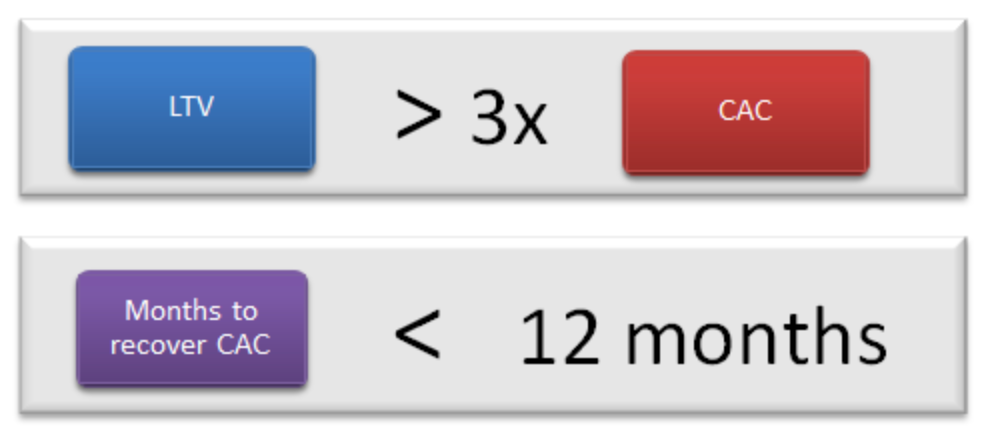
The 3:1 rule of thumb comes from David Skok’s SaaS Metrics 2.0, written for software and other subscription businesses. His viability guideline is LTV above 3 times CAC, and he reports that the best SaaS businesses run higher, sometimes 7 or 8.
His second guideline is recovering CAC in under 12 months, and he notes that many of the best SaaS businesses do it in 5 to 7. Past 12 months, his model shows profitability turning weak.
Both guidelines were built for software subscriptions and their margin structure. A brand selling physical goods starts from a different cost base.
Why the 3:1 rule breaks for DTC and CPG brands
A few structural differences do most of the damage.
First, a software subscription carries almost no fulfillment cost per customer. A DTC brand pays for product, packaging, pick and pack, outbound shipping, payment processing and the cost of returns on every order, and those costs sit inside the number before marketing touches it.
Second, repeat purchases from one-time ecommerce customers are not contractual. A SaaS company can track a monthly churn rate directly from subscription cancellations, while a DTC brand selling through one-time orders has no equivalent churn event to record, so customer lifespan itself is never directly observable.
A customer who has not reordered in nine months might be gone, or might just be on a long replenishment cycle. Projecting a customer churn rate onto that kind of behavior invents an average customer lifespan nobody observed.
That is why DTC lifetime value should run on a cohort measured over a fixed window, not a projected churn rate.
CAC looks different too. SaaS CAC is mostly sales and marketing headcount and programs. DTC CAC is mostly paid media plus the creative and agency cost of running it.
There’s a third reason inside the guideline itself. Skok’s 3:1 figure assumes the simpler LTV formula with no gross margin adjustment, plus a gross margin of 80% or higher. In other words, it’s a revenue-based ratio for a business that keeps most of every dollar. None of the four consumer brands in the table below reaches that margin.
Reported gross margin also means different things at different companies, which makes it a bad starting point for comparing brands at all.
Hims & Hers includes product and packaging costs, shipping, and medical consultation costs in cost of revenue. FIGS reports fulfillment and shipping below the gross margin line, in operating expenses instead of cost of goods.
Purple and Vita Coco add durable goods and beverage CPG. Across just these four filings, there are two ways of drawing the cost-of-goods line before anyone gets to contribution margin.
Company and category
FY2025 gross margin
What the filing says sits in or out of cost of goods
Source
Hims & Hers (health subscription)
74%
Cost of revenue includes product and packaging, shipping, and medical consultation costs
Figures from each company's FY2025 SEC filing. Shown to illustrate how much reported gross margin varies and how differently brands classify fulfillment costs. These are not LTV to CAC benchmarks.
How to calculate the LTV to CAC ratio for a DTC brand
Use contribution margin for LTV
Three margin layers matter here. CM1 is net revenue minus landed product cost, close to gross profit for brands that keep fulfillment out of cost of goods.
CM2 subtracts fulfillment, outbound shipping, payment fees and the cost of returns. CM3 subtracts marketing. LTV should run on CM2, because CM2 is the cash a customer leaves behind before a brand spends anything to acquire the next one.
Cohort LTV equals the cumulative CM2 a monthly cohort of new customers generates over a fixed window, 90 days, 12 months, or 24 months. Divide that by the number of customers originally acquired in that cohort. The standard SaaS formula, as Skok lays it out, multiplies average revenue per account by gross margin and divides by the churn rate.
That math needs a cancellation event, which a one-time DTC purchase never generates. Pull orders and costs from the order system and from finance, not from an ad platform’s pixel.
Who builds the model depends on the brand’s size. At early-stage brands, the founder usually does it. Smaller brands tend to hand it to a finance lead or a fractional CFO. In the mid-market, it comes down to revenue and whether there’s a data team. Brands without one put the model with the Head of Growth, a lifecycle marketer or the VP of Ecommerce, while brands with one give it to a Head of Data, a data analyst or a BI engineer, as larger brands do. Whoever builds it, finance should still set the definitions it runs on.
Use fully loaded CAC
Customer acquisition cost is the total cost to bring on new customers in a period, divided by the number of new customers acquired. Fully loaded means media spend plus agency fees, creative production, the acquisition tools, and the people who run acquisition. A platform dashboard's line item never shows the full number.
Brad Coffey, writing as HubSpot’s VP of Strategy in Skok’s piece, makes the same point: count every cost, and count it the same way each period. He warns specifically against counting only marketing program spend and leaving out headcount, which makes CAC look cheaper than it is.
Two rules keep the denominator honest. Count only first-time customers, never a returning customer a retargeting ad happened to touch. Drop any first order that was fully refunded or canceled; it was never really acquired.
Read it with payback period
The ratio alone says nothing about timing. The CAC payback period, in months, equals fully loaded CAC divided by the CM2 an average new customer generates per month.
That average can hide uneven months, so the example below tracks cumulative CM2 to find the payback month. For a brand holding inventory, a slow payback ties up cash that has to fund the next purchase order before the last one has paid for itself.
Skok’s original guideline was 12 months. His definitions page now says that figure dates from around 2011, that healthy SaaS businesses commonly take about 20 months, and that above 24 months is the point to work on it.
A DTC brand should set its own limit from its cash cycle. The inputs are fully loaded CAC and the cohort’s CM2 over a window that fits the category.
Illustrative example: a brand spends $60 fully loaded to acquire a customer. The average customer in that cohort generates $135 of CM2 over 12 months, a 12-month LTV to CAC ratio of 2.25:1. If that customer generates $25 of CM2 in month one and $10 a month after that, CAC pays back in month five.
What is a good LTV to CAC ratio for ecommerce?
Ecommerce has no single good ratio, since 3:1 is SaaS guidance that never fit the category. A DTC target depends on three things: how fast customers repurchase, how much of revenue comes back as returns, and how much margin survives fulfillment.
Pair whatever ratio a brand lands on with a payback limit. A strong-looking ratio means little if it takes three years to realize.
One threshold holds in every category: below 1:1 on CM2, a cohort hasn’t earned back its acquisition cost within the window you measured.
A high ratio only helps if payback fits the brand’s cash cycle. A cohort that clears its CAC in four months can fund the next purchase order. One that needs 18 months has to borrow or wait, whatever its ratio says.
Returns alone are a real, measurable drag that a revenue-based ratio hides completely.
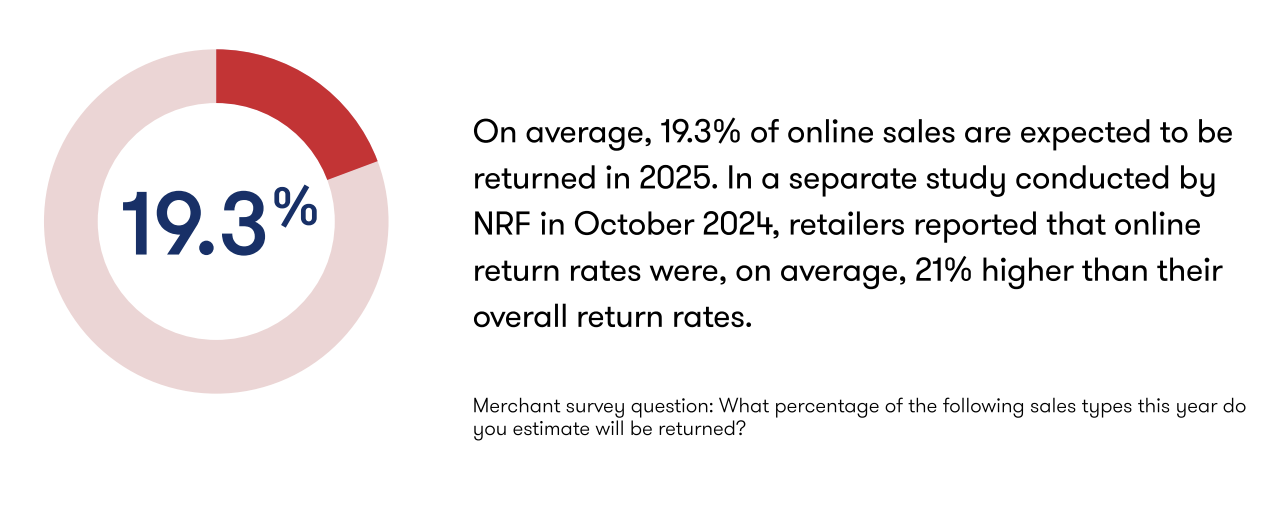
NRF and Happy Returns, a UPS-owned returns-management vendor, estimate that 19.3% of online sales will be returned in 2025, and apparel sits well above that average.
Returns are a measurable drag that a gross-revenue ratio hides. In the 2025 Retail Returns Landscape from NRF and Happy Returns, a UPS-owned returns vendor, retailers estimated that 19.3% of online sales would be returned in 2025. The estimate comes from a survey of ecommerce staff at merchants above $500 million in revenue, so treat it as directional for a smaller DTC brand.
Returns are a measurable drag that a gross-revenue ratio hides. In its 2026 Total Retail Loss Benchmark Report, Appriss Retail, which sells returns-management software, estimates that processing a return costs retailers about 30% of the item’s value. The figure is drawn from Appriss client data across U.S. retail, so treat it as directional for a DTC brand.
A brand that builds LTV on gross revenue never sees that cost until it shows up in the bank balance.
Category
Repeat behavior
Returns exposure
How to set the target
Consumables and replenishment (supplements, coffee, personal care)
Frequent, predictable reorders
Low
A longer LTV window can be justified because repeat is predictable; hold to a short payback limit
Subscription (boxes, replenishment plans, health subscriptions)
Contracted cadence, cancellations observable
Low to moderate
Closest to the SaaS logic; set payback in billing cycles, not months
Apparel and footwear
Seasonal, fit-driven
High for online sales
Run LTV on CM2 net of returns; a ratio built on gross revenue overstates the most here
Durable goods (mattresses, furniture, cookware)
Multi-year gaps between purchases
Moderate, heavy freight
Judge the first order on its own; do not count on repeat to cover acquisition
Food and beverage CPG with a DTC channel
Frequent, but DTC is often a minority channel
Low
Separate DTC cohorts from retail sales before calculating; shipping cost per order is the main drag
Constant Hire framing based on how each category's cost and repeat structure works. Not sourced benchmarks.
Treat an apparel brand’s numbers like a consumables brand’s and an inflated ratio can look healthy long after the cash says otherwise. If returns are what’s dragging the number, our guide to apparel brand hiring covers which roles move return rates first.
Calculate a target from your own cohorts and cash cycle. Most published “benchmarks” come from vendor dashboards built on inconsistent definitions of LTV, CAC and margin, which makes brand-to-brand comparisons unreliable.
Why platform ROAS gives a misleading picture
Meta attributes a purchase on a brand’s website to an ad when it happens within a set number of days after someone viewed or clicked that ad.
Google calls this a conversion window and lets advertisers set it anywhere from 1 to 90 days, depending on the conversion source. TikTok runs its own click and view attribution windows inside Ads Manager.
The same order can get claimed as a win inside three separate dashboards, and the sum of what every platform reports can run higher than what the store booked.
View-through credit compounds the problem. A platform can count a purchase from someone who was already planning to buy, because they saw an ad somewhere along the way.
Apple's App Tracking Transparency framework requires an app to request permission before tracking a person across other companies' apps and websites.
Google, for one, adds modeled conversions to its reported totals when it can’t observe them directly, and its help page addresses iOS privacy changes specifically. That makes platform ROAS useful for steering bids inside one platform and a poor answer to whether a dollar of ad spend made money.
Run the break-even math on margin instead of revenue and the picture changes fast. Illustrative example: a naive break-even ROAS, 1 divided by gross margin, is about 1.7 at a 60% gross margin. The real break-even, 1 divided by CM2 margin, is 4.0 at a 25% CM2 margin.
That figure still leaves out agency fees, creative production, tools, and acquisition headcount, so a fully loaded break-even sits higher still. Both figures are illustrative, but the gap between them is the whole point.
A campaign that looks profitable on a platform dashboard can lose cash once fulfillment and returns come out.
In 5 of the 31 job briefs we worked on for DTC and CPG brands between September 2025 and October 2026 that name LTV, the brand explicitly told the hire to judge results beyond what the ad platform reports.
Marketing efficiency ratio (MER), also called blended ROAS, is total revenue divided by total marketing spend across every channel. It’s a good check on any single platform’s claims, but it’s still revenue-based, so it carries the same margin blind spot.
Metric
What it tells you
Who should read it
In-platform ROAS
Which creative, audience or campaign is working inside one platform this week
Media buyers, for testing and bid decisions
MER (total revenue divided by total marketing spend)
Whether total marketing spend is paying off across all channels
Head of Growth, CMO, CEO
New-customer CAC (fully loaded)
What a genuinely new customer costs, from order data
Head of Growth with finance
Cohort LTV to CAC on CM2, with payback
Whether acquisition creates cash over a defined window
CEO or GM, CFO, Head of Growth
Constant Hire framing.
Who should own the LTV to CAC ratio?
At a CPG or DTC brand, ownership of the LTV to CAC ratio is shared. The Head of Growth or Chief Marketing Officer (CMO) drives the CAC side. The CFO or Head of Finance drives the margin-adjusted LTV side. The CEO or General Manager (GM) is accountable for balancing unit economics against cash flow.
That split exists for a reason. If the team spending the budget also defines the margin math, the number drifts toward whatever justifies more spend.
If finance alone controls it and nobody owns a growth number, testing slows down.
What each seat owns
Six seats touch the ratio day to day, and each one owns a different lever for moving it.
Seat
Owns
Levers that move the ratio
CEO or General Manager
Final call on growth versus cash; signs off on CAC ceilings and payback limits
Capital allocation, pricing and channel mix decisions
Building and maintaining the cohort model to finance’s definitions
Data quality, joining orders to costs, cohort refresh cadence
Constant Hire framing.
Finance sets the formula and the CAC ceiling, growth decides how to spend inside it, and the CEO or GM settles it when the two sides disagree.
What real job briefs show
Our own job briefs show how brands scope the CAC side. Of the 31 briefs we worked on for DTC and CPG brands between September 2025 and October 2026 that name LTV or lifetime value, 14 were growth seats: Head, Director or VP of Growth and similar titles.
Another 7 were retention or ecommerce roles, 4 were paid or performance roles, 3 were creative, and one each went to a data analyst, an SVP of Marketing, and a Fractional CFO.
None was titled Chief Commercial Officer, Chief Growth Officer or RevOps. In this set, brands scoped the CAC side into growth, retention and paid roles rather than one commercial executive.
Five of the 31 explicitly paired the growth hire with finance on unit economics or an acquisition threshold, which is the shared-ownership split above written into a job description.
When one executive takes both sides
At larger brands, a Chief Growth Officer or Chief Commercial Officer sometimes takes acquisition and retention together, with finance still setting the math underneath them. Whether either seat fits your brand is a separate hiring question, covered on those pages.
Hiring for both sides of the ratio
Somebody still has to own each side of the number. At Constant Hire, we place growth, retention, performance and finance leaders at DTC and CPG brands, drawing on our proprietary database of vetted ecommerce candidates.
If the gap is a person who can own the CAC side against a finance-set ceiling, or a finance lead who can build the cohort model, that’s the search we run.
There is no single good LTV to CAC ratio for ecommerce. The 3:1 rule comes from SaaS guidance built for software subscriptions. A DTC brand should calculate the ratio on contribution margin after fulfillment, shipping and returns, then set its target by category, repeat cycle and how quickly acquisition cost pays back in cash.
How do you calculate the LTV to CAC ratio?
Divide customer lifetime value by customer acquisition cost. For a DTC brand, take the contribution margin a cohort of new customers generates over a fixed window, such as 12 months, and divide it by fully loaded CAC. Fully loaded CAC is media, agency fees, creative, tools, and acquisition headcount, divided by the number of genuinely new customers.
Who should own the LTV to CAC ratio?
Ownership is usually shared. The Head of Growth or Chief Marketing Officer (CMO) drives the CAC side, and the CFO or Head of Finance owns the margin-adjusted LTV side and the formula. The CEO or General Manager is accountable for balancing unit economics against cash flow.
Connor Gross founded Constant Hire in 2024. An operator turned founder with deep experience building and scaling e-commerce brands. He previously sold an Amazon brand and generated over $30M in DTC revenue through private-label Shopify businesses. He now helps fast-growing DTC brands and agencies hire top talent across marketing, creative, ops, and sales. From E‑com Managers to TikTok Creators and Heads of Growth, he knows what great looks like, and how to recruit it.